Module summary
- Fundamental analysis asks why a currency should move; technical analysis asks where and when price has reacted before.
- Sentiment and positioning show how crowded a view already is.
- Analysis becomes useful only when it defines an entry, an exit if wrong, and a position size.
Forex analysis covers every method traders use to form a view on an exchange rate. The methods fall into three families: fundamental, technical and sentiment. Each answers a different question, and each has blind spots. This module explains how they work, then shows how a view becomes a plan with defined risk.
Fundamental forex analysis
A currency's value reflects demand for the assets priced in it, and the strongest single influence on that demand is the return those assets offer. Fundamental analysts therefore focus on interest rates and the data that shape them.
Interest-rate differentials
If one central bank's policy rate is 4.25% and another's is 2.00%, the gap is 2.25 percentage points (illustrative figures). A wider or widening gap tends to support the higher-yielding currency, because investors earn more by holding it. What moves markets, though, is the change in expected rates, which is why a central bank statement can move a pair more than the decision itself.
Economic data
Inflation, employment, growth and purchasing-manager surveys are released on published calendars. Markets react to the surprise relative to forecasts, not to the number itself. A strong figure that was expected can leave a currency unchanged.
Flows and risk appetite
Trade balances, investment flows and hedging programmes move currencies over longer periods. In sharp sell-offs, money tends to move into currencies seen as safe havens, overriding local fundamentals for a while.
Technical analysis on currency charts
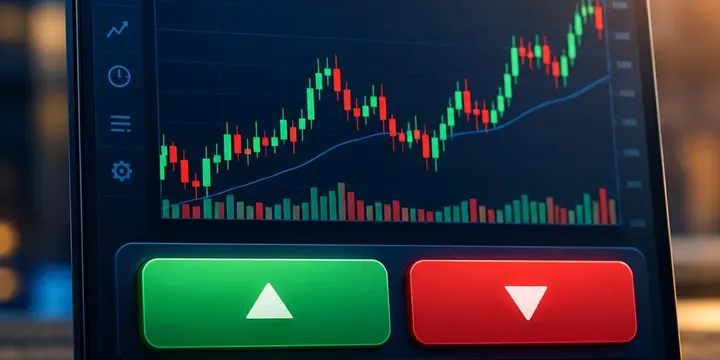
Technical analysis studies price itself: where it has turned, how fast it has moved, and how it behaves around levels that many participants watch.
- Trend structure. Higher highs and higher lows describe an uptrend; the reverse, a downtrend. Many traders only trade in the direction of the higher-timeframe trend.
- Support and resistance. Areas where price has repeatedly reversed. They are zones, not exact lines.
- Moving averages. The average of recent closes. For illustrative closes of 1.0812, 1.0830, 1.0845, 1.0821 and 1.0852, the five-period average is 1.0832. Price above a rising average suggests upward momentum.
- Momentum oscillators. Tools such as RSI measure the speed of recent moves and can highlight stretched conditions.
Technical tools describe; they do not predict. Their value comes from defining where a trade idea is wrong, which is the foundation of risk control.
Sentiment and positioning
Sentiment analysis asks how many participants already hold a view. If most speculative money is already long a currency, good news may have little left to push it higher, and bad news can trigger a rush for the exit. Regulators and exchanges publish positioning data for currency futures, and some providers show the split of their clients' positions. These are rough gauges, useful for spotting crowded trades rather than for timing entries.

Combining the approaches
Many traders use fundamentals to decide direction and a timeframe, technical analysis to choose entry and exit levels, and sentiment as a warning light. A common sequence:
- Identify a fundamental driver, such as a widening rate gap.
- Check that the higher-timeframe chart agrees, or wait until it does.
- Find a level where the idea would be clearly wrong.
- Size the position so that being wrong costs a fixed, small share of the account.
From view to plan: a worked example
Illustrative numbers. You expect EUR/USD to rise and plan to buy at 1.0900, with a stop at 1.0860 and a target at 1.0980.
- Risk: 1.0900 − 1.0860 = 40 pips.
- Reward: 1.0980 − 1.0900 = 80 pips.
- Reward-to-risk: 80 ÷ 40 = 2, often written 1:2.
- Break-even win rate before costs: 1 ÷ (1 + 2) ≈ 33.3%.
At a 1:2 ratio, a strategy that is right only one time in three roughly breaks even before costs. Costs push that threshold higher, which is why the fees module matters for analysis too. Convert the 40-pip stop into a lot size with the position size calculator before placing anything.
Common analysis mistakes
- Treating a forecast as certain and skipping the stop.
- Adding indicators until they agree, which usually means they all measure the same thing.
- Ignoring the economic calendar and holding through a major release by accident.
- Judging a method on a handful of trades instead of a meaningful sample.
For the mechanics of pairs, pips and sessions, see the forex module.
Currency correlations
Many pairs share a currency, so their moves are linked. EUR/USD and GBP/USD often move in the same direction because both are priced against the dollar; a long position in each can amount to one large bet against the dollar rather than two independent trades. Pairs such as EUR/USD and USD/CHF frequently move in opposite directions for the same reason. Before opening several positions, list the currencies you are effectively long and short across all of them. If the list is lopsided, your real risk is larger than any single position suggests.
Building a repeatable routine
Analysis is most useful when it is done the same way each time. A simple routine might be: check the economic calendar for the day and week; note where each pair you follow sits relative to its higher-timeframe trend and key levels; write down any trade idea with its entry, stop, target and reason; and review ideas that were not taken as well as those that were. Keeping a written record turns analysis from a feeling into something you can evaluate. Over a few months, the record will show which parts of your process add value and which only add confidence.
Reading an economic calendar
An economic calendar lists scheduled releases with the time, the country, the previous figure, the consensus forecast and, once published, the actual figure. The gap between actual and forecast is what moves prices. Calendars usually rate each release by expected impact; central bank decisions, inflation and employment reports tend to sit at the top. For a short-term trader, the most practical use is defensive: knowing when volatility is likely, so a position is not left exposed by accident, and allowing for wider spreads in the minutes around a release.
A final point on evaluation: judge a method by its results over many trades, including costs, and compare them with what you expected before you started. A method that fits your schedule and temperament, and that you can follow consistently, is worth more than a sophisticated one you abandon after a losing week.
Questions from readers
Is technical or fundamental analysis better for forex?
Neither is better in general. Fundamentals help explain longer-term direction, while technical analysis helps with timing and defining risk. Many traders combine both.
Which timeframe should I analyse?
It depends on how long you intend to hold a trade. A common approach is to read direction on a higher timeframe and time entries on a lower one.
Do economic releases always move currencies?
Only when the result differs from what markets expected, or when it changes expectations for interest rates. A result in line with forecasts may cause little movement.